In the fifth exercise we should have a surface area of accounting in the vector layer tu_kl.shp digitized departments create the University of Kaiserslautern.
first I was, as always, the project settings.
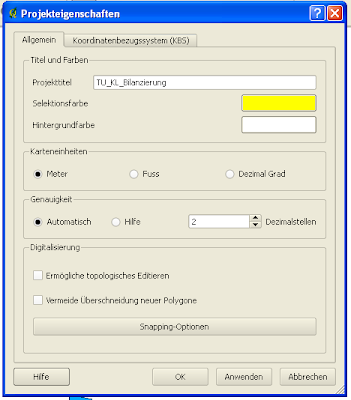
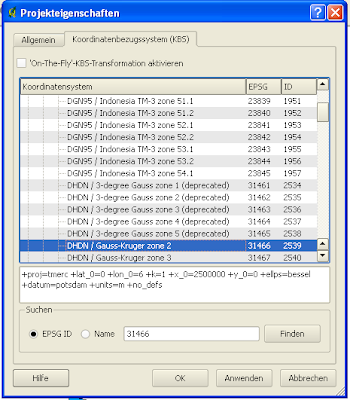
as project title, I was "TU_KL_Bilanzierung", which map units set to meters and KBS chose to Gauss-Kruger zone 2 (EPSG 31 466) from.
generally Pojekteigenschaften:
project properties KBS:
Next, I imported the vector layer tu_kl.shp.
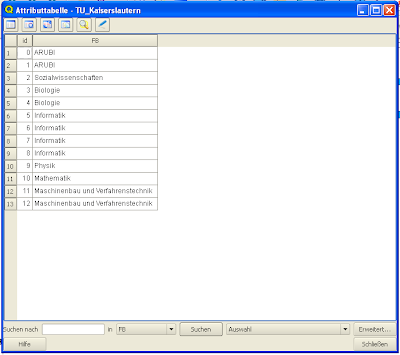
In this layer some Building of the TU KL digitized and classified by subject areas.
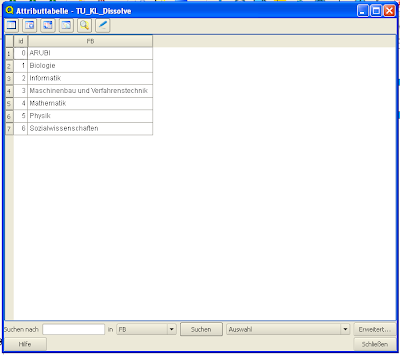
attribute table TU_Kaiserslautern: summarize
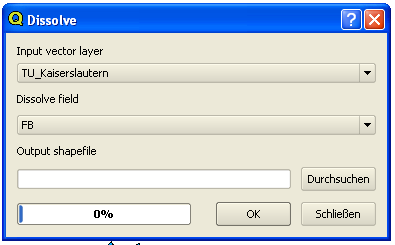
To the individual departments in the attribute table by one point, I used the Dissolve function.
The input vector layer, I chose "TU_Kaiserslautern" and Dissolve Field "FB" (departments).
The layer was saved as TU_KL_dissolve.shp.
menu Dissolve function:
attribute table TU_KL_dissolve:
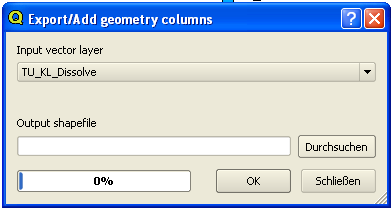
To an area I used to create accounting tools / Geometry Tool / Export / Add Geometry Columns.
The input vector layer, I chose "TU_KL_dissolve" from. The new Vector Layer I saved as TU_KL_Bilanzierug.shp.
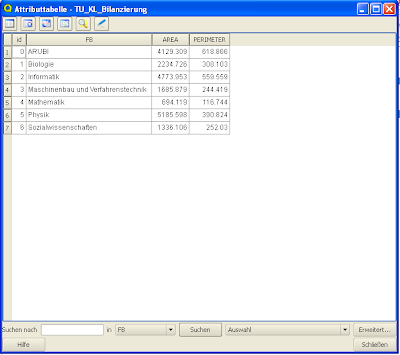
In the attribute table were so to the already existing columns additionally "AREA" and "Perimeter" added.
menu Export / Add geometry columns:
attribute table TU_KL_Bilanzierung:
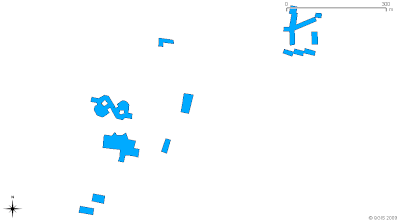
Screenshot entire ad:
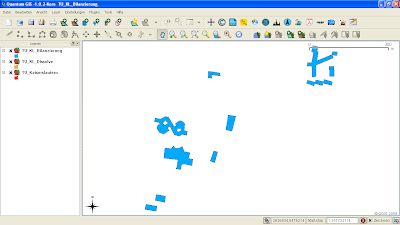
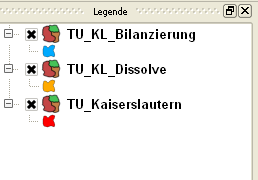
Legend:
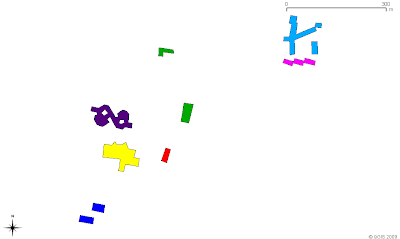
Score Card: (classified FB and differently colored)
scorecard II:
The QGIS file, and created shape files were, as always CD burned and released in the teaching field.
0 comments:
Post a Comment