In the second exercise, we should create a small QGIS project should have the specific properties and content. Basis represents the topographic map 100 of Rheinland-Pfalz dar. It should be placed several Layer. The administrative boundaries of the districts, unitary councils and local congregations. Finally, a layer should be created with the reserves. The borders of the different administrative boundaries should be consistent with different line width and color are represented. Local communities and protected areas should be marked in appropriate color.
Another benefit should still be zoomed to the local church Weilerbach and a picture of the local community can be created.
The release of QGIS file and the image of Weilerbach was on CD.
After starting QGIS, you must first click on "New Project". The project title should be "Übung_2_ (last name) _ (first name)" for example.
hit The first thing in his new project a few settings: The map units must be in "feet" are provided and the coordinate system must be placed on Gauss-Kruger zone 2. To get into the menu for the preset you have to Settings and then click Project Settings. The map units are then set under "General", the coordinate system under "Coordinate Reference System (KBS) is selected.
project properties:

order now choose to download the map with it, the project is the button "Raster Layer Add "and in the opening menu to select the layer (in this case the card TK100_RLP located in the. tif is format).
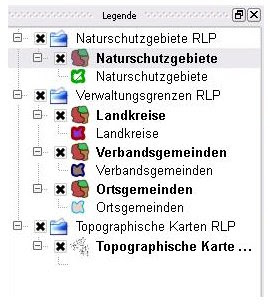
The layer with the administrative boundaries and the nature reserves are on the button" vector layer to add selected "in the QGIS project added. The individual cards I added in succession. For the different cards I created in the legend groups. But you have only a right click in the legend and click on "New Group". I created a group on topographic maps RLP "under I ranks the TK100_RLP. I notified the card in "Topographic Map of 100" to. Next, I created a group for the Administrative boundaries under which I ordered the local communities, municipalities and the Association of Counties. The individual layers to be exactly what I called. As the last group, I created "nature reserves RLP" I class it among the layer with the reserves.
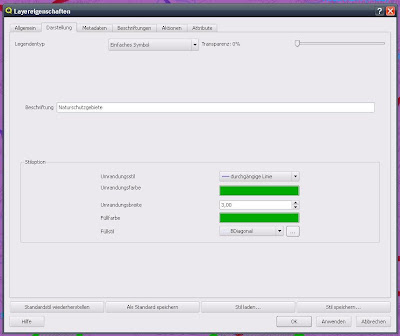
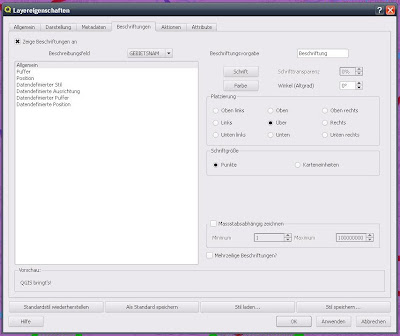
Next I took care of the required layer properties. This I did in the legend for the layer that I wanted to edit just right click and chose "Properties". In the opening menu, I chose the "representation" at the border style, border color and border width set. In the counties and the association communities, I left it at these settings. In local communities and the reserves, I made a few more settings. In local communities, I am still clicked in the box labeled "Check the checkbox to" Show labels on "set. In the Description field, I then had to "NAME" menu. After clicking Apply, have also been shown the names of the local communities. The font size I chose a font size 14 and the font color I chose the same color with which I had outlined in the local communities. With the same approach I made the show the name of the protected area. Only the description field you had here, "GEBIETSNAM" option. In the "View" I selected in the reserves also have a fill color (the same color as the outline and the inscription of the nature reserve) and a fill (BDiagonal). The border width should be different in the three administrative layers. I chose it for the edge width 3 for the counties, border width 2 for the Association of Municipalities and a border width for the local communities, because everything is so beautifully clear, though, switching to the particular zoom level. The protected areas should also be presented with a border width 3.
Layer properties: "display"
Layer Features: "Labels"
Finally, I took care not to change the order of the different layer groups in the legend. The topographical map I placed all the way down, because it is the map. Furthermore, I positioned the administrative borders with a hierarchical order: Local communities - Association of Municipalities - Counties (from bottom to top in the legend). So you can always just click on the desired layer.
Legend:
So you can also view all layers at the same time, I put in the Layer properties of the administrative boundaries still display the transparency. I challenged them each to 40 percent. In the reserves I placed a no transparency because they are in the legend at the top are and thus can be shown always (the color is also so strong). Should I add more layers, I would set the protected areas is also transparent, in this case, this is not absolutely necessary.
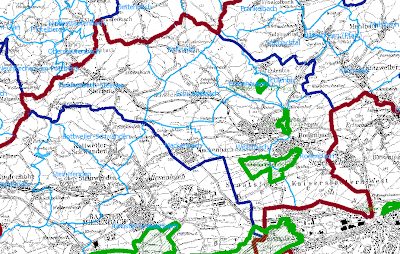
As a final point, I zoomed in my practice nor to the local community Weilerbach (to 1:50 000). Selected from all layers and save the image as I in the program to "File" then "Save Image As ..." to clicked. The image was as. png file.
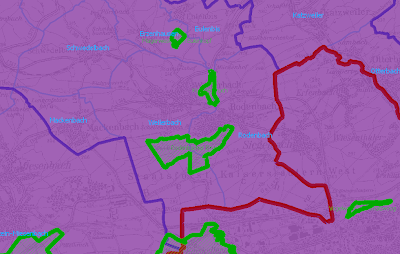
activates all the layers:
- Protected Areas
- Local communities
- Association of Municipalities
- Counties
- Topographic Map 100
The QGIS file and the png. image file from Weilerbach I burned to a CD that I gave then.
more images from Weilerbach On / Off by different layers:
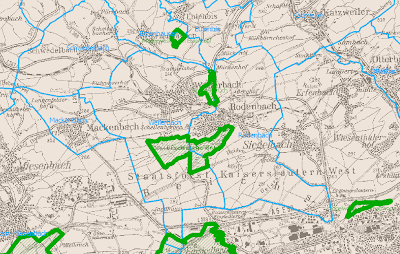
Layer
activated - Local communities
- Protected Areas
- Topographic Map 100
activated Layer:
- Local communities
- Association of Municipalities
- Protected Areas
- Topographic Map 100
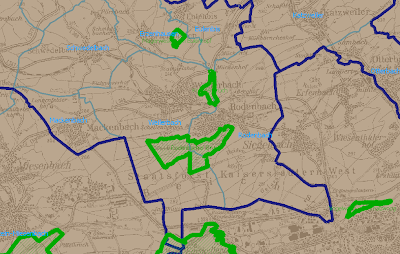
result
enabled all layers
Fill the vector layer disabled